Cloudiness
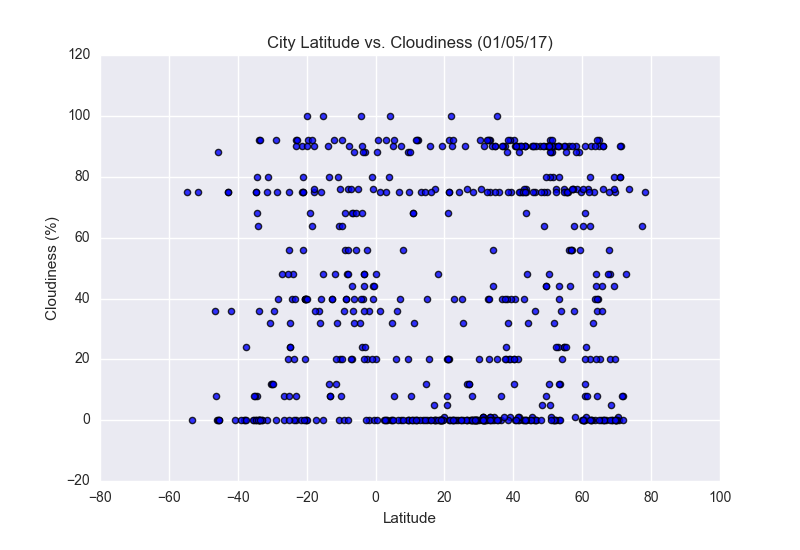
The plot of Latitude versus Cloudiness, shows little discernable trends across latitudes. Across all latitudes, more datapoints are showing 0 cloudiness than any other level. The vertical striations in the cloudiness plot is not observed in the other plots. I believe this has to do with the way the data is collected. The striations appear to be the result of human nature involved in an estimation processs. Most of the cloudiness measurements fall upon 10's and 5's with a high number of 75% occurances.
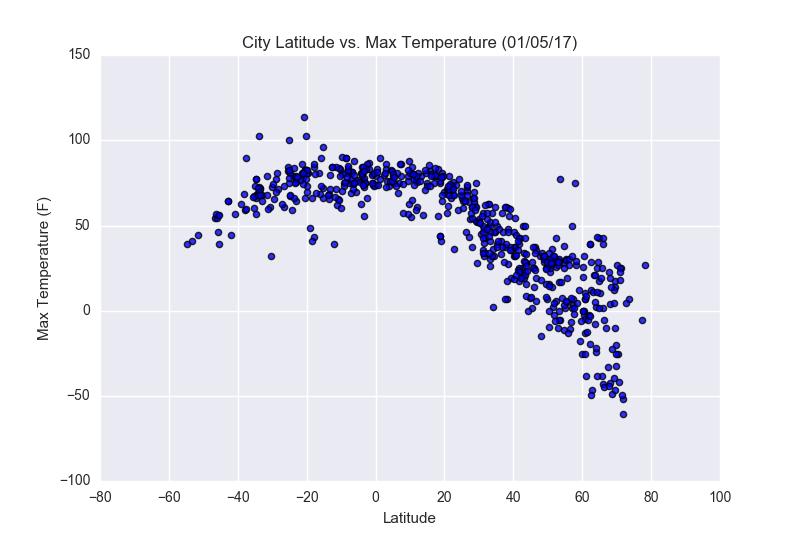
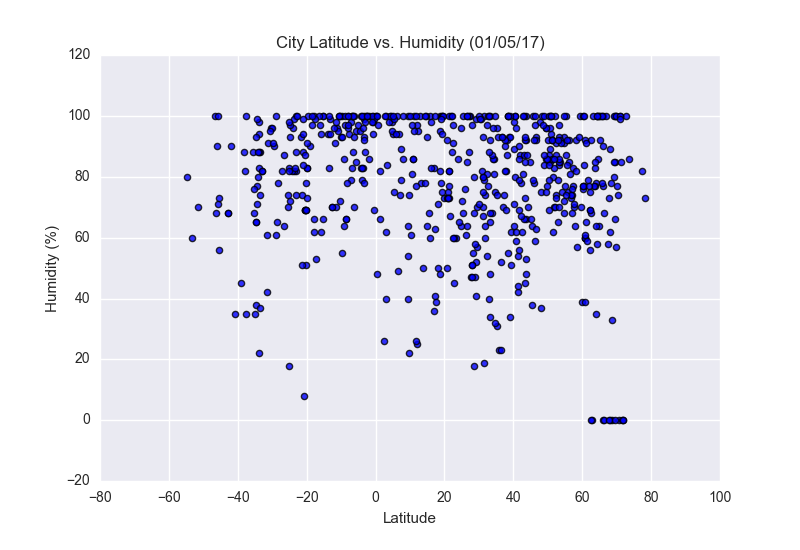
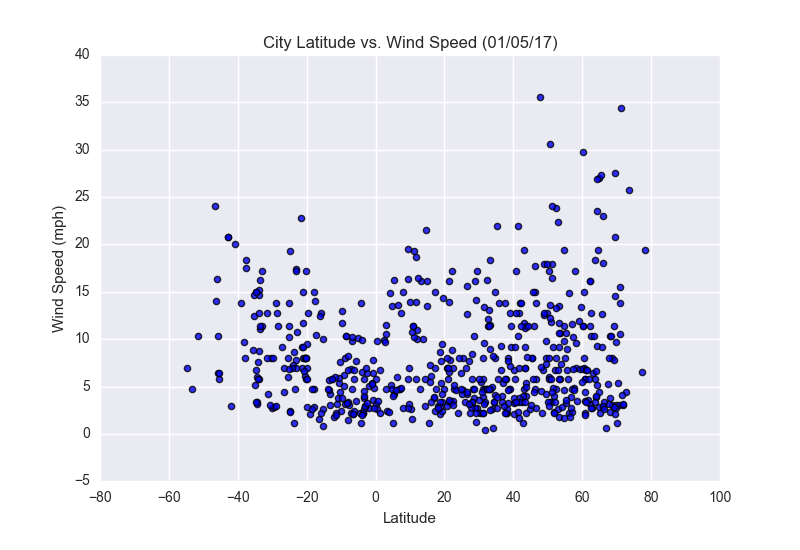
Visualizations