Humidity
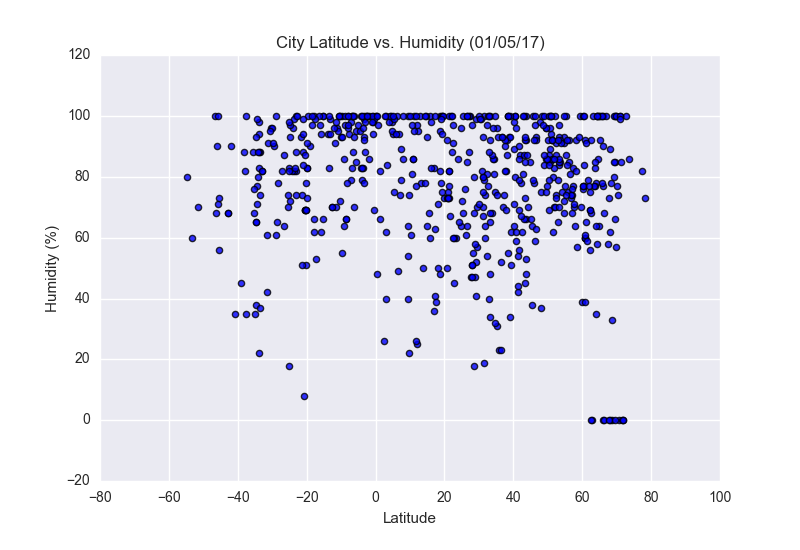
The Latitude vs Humidty plot primarily illustrates that there is a broad range of humidity at all latitudes with 40% to 100% being found in most latitudes. This dataset does see to show that there are fewer low humidity data points at the equator and the poles with the middle latitudes displaying the lowest humidity data points.
Visualizations